Apache Kafka Log Aggregation: A Complete Guide for Developers and Data Engineers
Apache Kafka is an open-source distributed event streaming platform developed by LinkedIn and now maintained by the Apache Software Foundation.
Kafka is designed for high-throughput, fault-tolerant, and real-time data pipelines. It’s often used for:
Stream processing
Event sourcing
Log aggregation
Data integration
Kafka’s architecture is built around four key components:
| Component | Description |
|---|---|
| Producer | Sends (publishes) messages to Kafka topics. |
| Topic | A logical channel to which records are sent. |
| Broker | Kafka server that stores and manages messages. |
| Consumer | Reads (subscribes) messages from topics. |
Kafka excels at scaling horizontally, making it perfect for environments that handle large volumes of logs from multiple systems.
Why Use Kafka for Log Aggregation?
Traditional logging systems struggle with the volume and velocity of modern application logs. Kafka solves this by acting as a buffer and broker for all log data in your organization.
Here’s why Kafka is an excellent choice for log aggregation:
Centralized Data Stream:
Kafka can collect logs from diverse systems — microservices, databases, IoT devices — and centralize them into one unified stream.Scalability:
Kafka handles billions of messages per day with ease, making it ideal for large-scale log management.Fault Tolerance:
Data replication ensures no logs are lost, even if a broker goes down.Integration with Analytics Tools:
Kafka integrates seamlessly with ELK Stack, Hadoop, Spark, Flink, and Grafana.Real-Time Processing:
Logs are available for analysis within milliseconds, empowering quick insights.
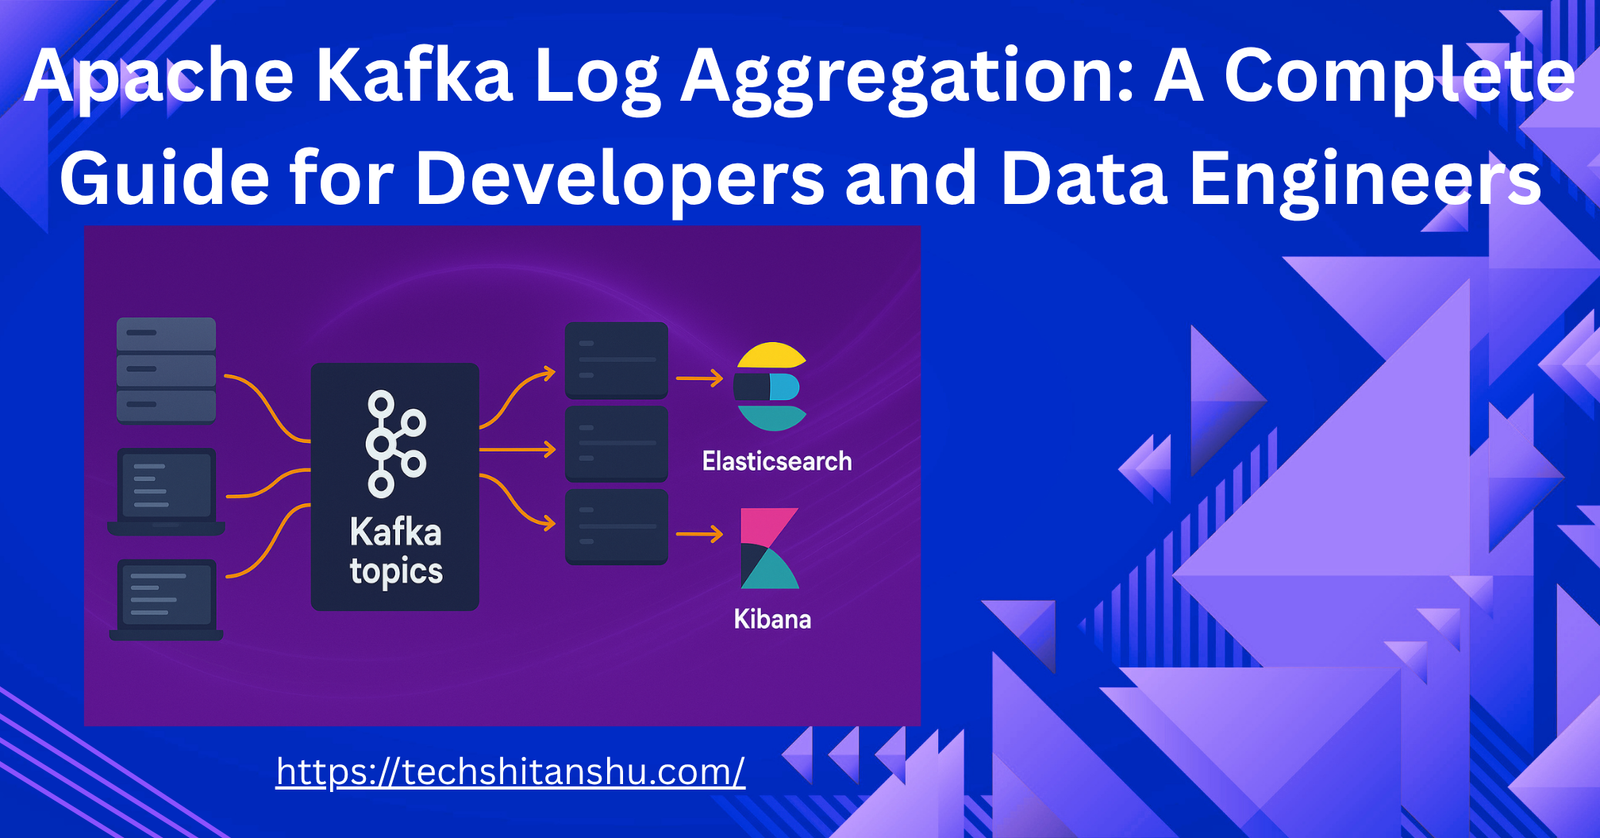
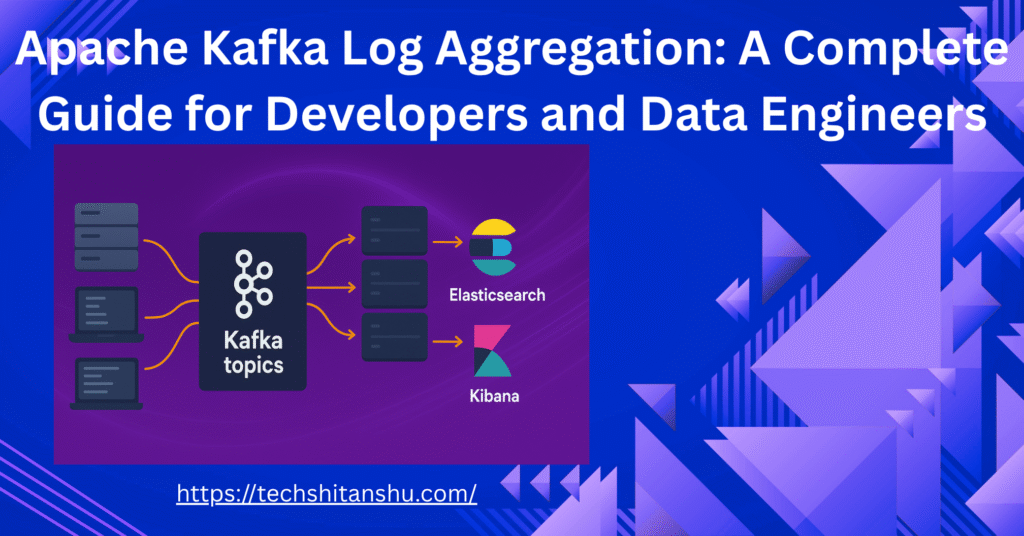
Kafka Architecture for Log Aggregation
Let’s visualize how Kafka fits into a log aggregation pipeline.
🔹 1. Log Producers
Applications, containers (like Docker), or agents (like Fluentd, Filebeat, or Logstash) act as producers. They send logs to Kafka topics in real time.
🔹 2. Kafka Cluster
The Kafka cluster, made up of multiple brokers, receives and stores logs in topics. Kafka ensures ordering, partitioning, and replication of data across brokers.
🔹 3. Kafka Topics
Logs are categorized by topics — for example:
app-logssystem-logssecurity-logs
Topics are divided into partitions to allow parallelism and scalability.
🔹 4. Log Consumers
Consumers can be:
Data processing systems (Spark, Flink)
Indexing engines (Elasticsearch, OpenSearch)
Storage systems (S3, HDFS)
Visualization tools (Kibana, Grafana)
Kafka Log Aggregation Pipeline Example
Here’s a simplified architecture for a Kafka-powered log aggregation system:
					Applications & Services
        ↓
   Fluentd / Filebeat (Log Shippers)
        ↓
   Apache Kafka Cluster (Topics)
        ↓
   Consumers (Elasticsearch / Hadoop / S3)
        ↓
   Visualization (Kibana / Grafana)
Resilience (thanks to Kafka replication)
Real-time processing
Scalability for millions of log events
Setting Up Kafka for Log Aggregation
Step 1: Install Apache Kafka
Download and extract Kafka:
wget https://downloads.apache.org/kafka/3.8.0/kafka_2.13-3.8.0.tgz
tar -xzf kafka_2.13-3.8.0.tgz
cd kafka_2.13-3.8.0
Start the ZooKeeper (if not using KRaft mode):
bin/zookeeper-server-start.sh config/zookeeper.properties
Then start the Kafka broker:
bin/kafka-server-start.sh config/server.properties
Step 2: Create a Kafka Topic for Logs
bin/kafka-topics.sh --create --topic app-logs --bootstrap-server localhost:9092 --partitions 3 --replication-factor 1
Step 3: Configure Log Shippers (Filebeat / Fluentd)
For example, with Filebeat, you can define:
filebeat.inputs:
  - type: log
    paths:
      - /var/log/*.log

output.kafka:
  hosts: ["localhost:9092"]
  topic: "app-logs"
This sends system logs directly to Kafka in real time.
Step 4: Consume Logs from Kafka
You can use a simple console consumer:
bin/kafka-console-consumer.sh --topic app-logs --from-beginning --bootstrap-server localhost:9092
Or connect Elasticsearch or OpenSearch to Kafka for indexing and visualization via Logstash or Kafka Connect.
🔄 Kafka Connect for Log Integration
Kafka Connect simplifies data ingestion and export between Kafka and external systems.
Common connectors:
Source Connectors (collect logs from systems)
Sink Connectors (send logs to storage)
Example Sink Connector (Elasticsearch):
{
  "name": "elasticsearch-sink",
  "config": {
    "connector.class": "io.confluent.connect.elasticsearch.ElasticsearchSinkConnector",
    "topics": "app-logs",
    "connection.url": "http://localhost:9200",
    "type.name": "_doc",
    "key.ignore": true,
    "schema.ignore": true
  }
}
Run it via:
curl -X POST -H "Content-Type: application/json" --data @es-sink.json http://localhost:8083/connectorsKafka Streams for Log Processing
If you want to transform or enrich logs, use Kafka Streams — a Java-based API for real-time processing.
Example use cases:
Filter out debug logs
Parse JSON fields
Compute error rates per service
Kafka Streams allows you to build custom log analytics pipelines directly in your application.
Kafka in Cloud and Containerized Environments
1. Kafka on Kubernetes
You can deploy Kafka using:
Strimzi Kafka Operator
Confluent for Kubernetes
This simplifies scaling, monitoring, and log routing in cloud-native systems.
2. Kafka on AWS or Azure
Use managed Kafka services like:
Amazon MSK (Managed Streaming for Kafka)
Azure Event Hubs (Kafka API compatible)
They eliminate infrastructure overhead, letting developers focus on pipeline logic.
Real-World Kafka Use Cases
Application Log Centralization
Collect logs from multiple microservices and push them to a single Kafka topic.Security Event Tracking
Kafka monitoring stream login attempts, firewall alerts, and anomalies for real-time security analytics.IoT Data Streams
Aggregate logs from millions of IoT devices in real-time.Operational Monitoring
Analyze system performance metrics and errors instantly with Kafka and Grafana.
Kafka APIs
Besides the handy command-line tools you use for setup and management, Apache Kafka comes with five core APIs that let you build, manage, and integrate powerful data streaming applications. These APIs are available in Java and Scala, but many have client libraries for other languages too.
Let’s break them down in simple terms:
🔧 1. Admin API
The Admin API is like your control panel for Kafka.
It allows you to create, configure, and monitor topics, brokers, and clusters. Think of it as the “management toolkit” — perfect for tasks like adding a new topic, checking configurations, or managing partitions.
✉️ 2. Producer API
The Producer API is what you use when you want to send data into Kafka.
It lets your applications publish streams of events (messages) to one or more Kafka topics.
For example, a web app could send user activity logs to a topic called user-events using this API.
📬 3. Consumer API
If the Producer API writes data, the Consumer API reads it.
It allows applications to subscribe to topics, read messages, and process them in real time.
This is how you build services that react to events — for instance, processing new orders as soon as they’re published to the orders topic.
🔄 4. Kafka Streams API
The Kafka Streams API takes things up a notch.
It’s a library for building real-time stream processing applications — the kind that can filter, join, aggregate, or transform data as it flows through Kafka.
You can do things like:
Combine multiple streams (joins)
Count events over a time window
Aggregate and summarize data in real time
It turns Kafka into a powerful data processing engine, not just a message broker.
🔌 5. Kafka Connect API
Finally, the Kafka Connect API helps you connect Kafka to other systems — databases, cloud services, file systems, and more.
It’s designed for data import/export without writing a single line of custom code.
For example, you can use an existing connector to:
Stream database changes from PostgreSQL into Kafka
Push Kafka data into Elasticsearch for analytics
You rarely need to build your own connector because the Kafka community has hundreds of ready-to-use connectors available.
🧩 In a Nutshell
Here’s a quick summary:
| API | Purpose | Use Case Example |
|---|---|---|
| Admin API | Manage Kafka objects | Create or inspect topics |
| Producer API | Write data to Kafka | Send logs or user events |
| Consumer API | Read data from Kafka | Build real-time dashboards |
| Streams API | Process data streams | Real-time analytics or transformations |
| Connect API | Integrate external systems | Sync data between Kafka and databases |
In short, these five APIs make Kafka incredibly flexible.
Whether you’re managing clusters, streaming data, or integrating with external systems, there’s a Kafka API designed to do the job — efficiently and at scale.
Best Practices for Kafka Log Aggregation
Use JSON or Avro formats for structured logging.
Partition by log source or severity for parallel processing.
Enable compression (gzip/snappy) to reduce storage.
Use schema registry to maintain consistent log formats.
Set log retention policies to avoid disk overuse.
Monitor Kafka with tools like Prometheus + Grafana.
Secure Kafka with SSL/TLS and authentication.
Security Considerations
Kafka Logging -Encrypt logs in transit (SSL) and at rest.
Implement ACLs for producers and consumers.
Regularly rotate credentials and keys.
Audit consumer lag and topic access patterns.
Understanding Consumer Offset Tracking in Kafka
One of Kafka’s most useful features is its ability to remember where a consumer left off. When a consumer reads messages from a topic, Kafka keeps track of how far it has read — this position is called the offset.
Think of offsets as bookmarks in a data stream. Each partition in a Kafka topic is like a chapter, and the offset tells Kafka which page (or message) the consumer last read.
Now, let’s break down how Kafka manages these offsets behind the scenes.
How Kafka Architecture Tracks Offsets
Every Kafka consumer keeps track of the highest offset it has successfully read from each partition. This offset information is stored (or “committed”) so that, in the event of a restart or failure, the consumer can pick up right where it left off instead of starting over.
Kafka provides a mechanism to store offsets for each consumer group on a special broker known as the group coordinator.
Here’s how it works:
Each consumer group is associated with a group name.
Based on that name, Kafka assigns a group coordinator broker to manage the group’s metadata — including offsets.
A consumer can find its coordinator by sending a FindCoordinatorRequest to any Kafka broker.
Once it gets a response (the FindCoordinatorResponse), it knows exactly which broker to communicate with for committing or fetching offsets.
If the coordinator moves or changes (which can happen when brokers rebalance), the consumer simply re-discovers it.
Committing Offsets — Automatic or Manual
Consumers can commit offsets in two ways:
Automatically, where Kafka periodically commits offsets in the background.
Manually, where your application explicitly tells Kafka when to commit (for example, after successfully processing a batch of messages).
Manual commits are often preferred for reliability — they ensure you only mark messages as “processed” after your logic completes successfully.
What Happens When Offsets Are Committed
When a consumer commits its offsets, the group coordinator receives an
OffsetCommitRequest.
Here’s what happens next:The coordinator appends the offset data to a special Kafka topic called
__consumer_offsets.Kafka waits until all replicas of that topic have received the update before confirming success.
Once confirmed, the broker sends back an acknowledgment to the consumer.
If replication doesn’t complete in time (for example, due to a network issue), the commit fails. In that case, the consumer waits briefly and tries again later.
The
__consumer_offsetstopic is a compacted topic, which means Kafka only keeps the most recent offset for each partition — older offset records are removed automatically to save space.Fast Offset Fetching
To make offset lookups faster, the group coordinator caches offsets in memory.
So, when a consumer asks for the last committed offset, the coordinator can instantly respond without hitting disk.If, however, the coordinator just started up or recently became responsible for a new set of consumer groups, it might need a few moments to load the offset data from the topic into memory.
During this brief period, the consumer might receive a
CoordinatorLoadInProgressException. That simply means the coordinator is still warming up — the consumer just needs to wait a bit and retry the request.
Comparison: Kafka vs Traditional Log Aggregation
| Feature | Kafka | Traditional Log System |
|---|---|---|
| Scalability | Horizontal scaling | Limited |
| Real-time Processing | Yes | Often batch-based |
| Fault Tolerance | Built-in replication | Manual backups |
| Integration | ELK, Spark, Flink, Hadoop | Limited |
| Cost | Open-source | Varies |
Kafka is not just a log collector — it’s a streaming backbone that powers entire data ecosystems.
Conclusion
Apache Kafka has transformed how modern systems handle logs. Its scalability, fault tolerance, and real-time capabilities make it the ideal backbone for log aggregation in both DevOps and data engineering pipelines.
By centralizing logs with Kafka, teams gain:
Unified visibility across systems
Faster debugging and analytics
Streamlined data integration
Whether you’re a developer managing microservices or a data engineer building pipelines, Kafka is a must-have tool in your observability stack.

Leave a Reply