

Candlestick Pattern – Part 2
3. Doji Candle
The term “Doji” comes from Japanese and literally means “the same thing.” In candlestick pattern, a Doji forms when a security’s opening and closing prices are virtually the same — meaning there’s no clear winner between buyers and sellers.
Visually, a Doji looks like a cross or plus sign, because the body of the candle is very small (almost just a line), while the upper and lower wicks (or shadows) can be long, short, or even nonexistent.
What Does a Doji Pattern Mean?
A Doji Candlestick pattern represents indecision or uncertainty in the market. It shows that during the trading session, both buyers and sellers were active, but by the end of the session, the price settled back to where it started.
It often signals a pause in a trend
It can be a warning sign that the current trend may be losing strength
But by itself, a Doji is not a strong buy or sell signal — traders usually wait for confirmation from the next candle or pattern before making a move
How Do Traders Use a Doji?
Because it reflects a balance between buying and selling pressure, traders interpret a Doji as a sign to:
Slow down and reassess
Wait for the next candle to confirm whether the market wants to reverse, continue, or just stay flat
Key Takeaway
A Doji Candlestick Pattern doesn’t tell you what will happen next — it tells you to pay attention.
Here’s a breakdown of the main types of Doji candles:
🟠 1. Standard Doji
Shape: Looks like a plus sign
+Open ≈ Close, with both upper and lower shadows of roughly equal length
Meaning: General indecision — neither bulls nor bears are in control
Context matters: In an uptrend, it could hint at a reversal; in sideways markets, it may just signal hesitation
🟢 2. Dragonfly Doji
(Visual: Long lower wick, little to no upper wick)
Open ≈ Close at the top of the candle
Long lower shadow, no (or very small) upper shadow
Interpretation: Bears pushed prices down, but bulls regained control by close
Bullish reversal signal if found after a downtrend
🔴 3. Gravestone Doji
(Visual: Long upper wick, little to no lower wick)
Open ≈ Close at the bottom of the candle
Long upper shadow, no (or very small) lower shadow
Interpretation: Bulls drove prices higher, but bears took control and pushed prices back down
Bearish reversal signal if seen after an uptrend
🔵 4. Long-Legged Doji
Open ≈ Close, but with very long upper and lower shadows
Shows strong indecision with high volatility — buyers and sellers were both aggressive, but canceled each other out
Common near key support/resistance levels or during market consolidation
🟣 5. Four Price Doji (very rare)
Open = High = Low = Close
Literally no price movement — looks like a flat horizontal line
Usually appears in low-volume or illiquid markets
Often ignored unless seen on very low timeframes
✅ How to Use Them (General Tips)
| Type | Potential Signal | Stronger When… |
|---|---|---|
| Dragonfly Doji | Bullish reversal | After a downtrend, confirmed by next candle |
| Gravestone Doji | Bearish reversal | After an uptrend, confirmed by next candle |
| Long-Legged Doji | Uncertainty/Volatility | Near support/resistance zones |
| Standard Doji | Neutral/Wait | Paired with trend context |
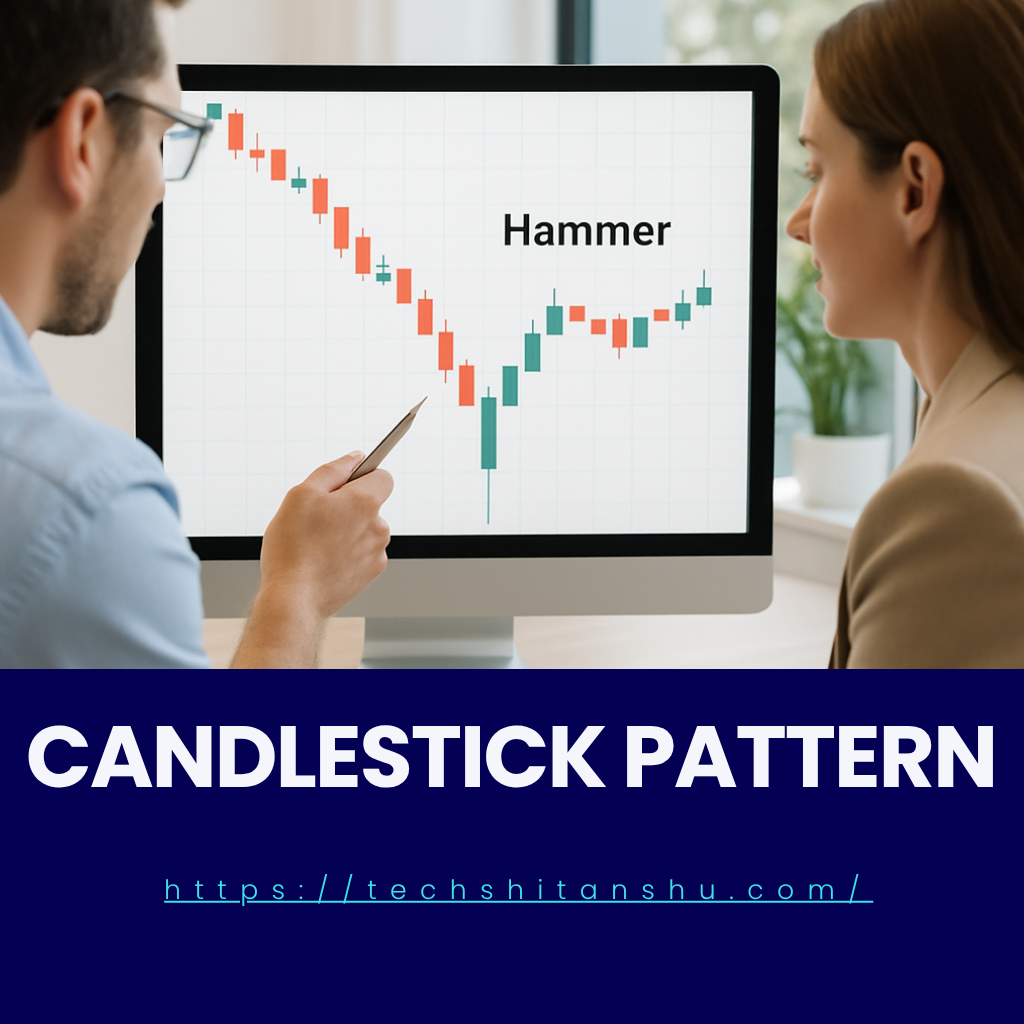
4. Hammer Pattern
The Hammer is a single candlestick pattern that looks like — you guessed it — a hammer! 🪓
It usually shows up after a downtrend and can be a signal that prices might start going up. Think of it like the market saying, “Hey, I’ve fallen enough — maybe it’s time to bounce back!”
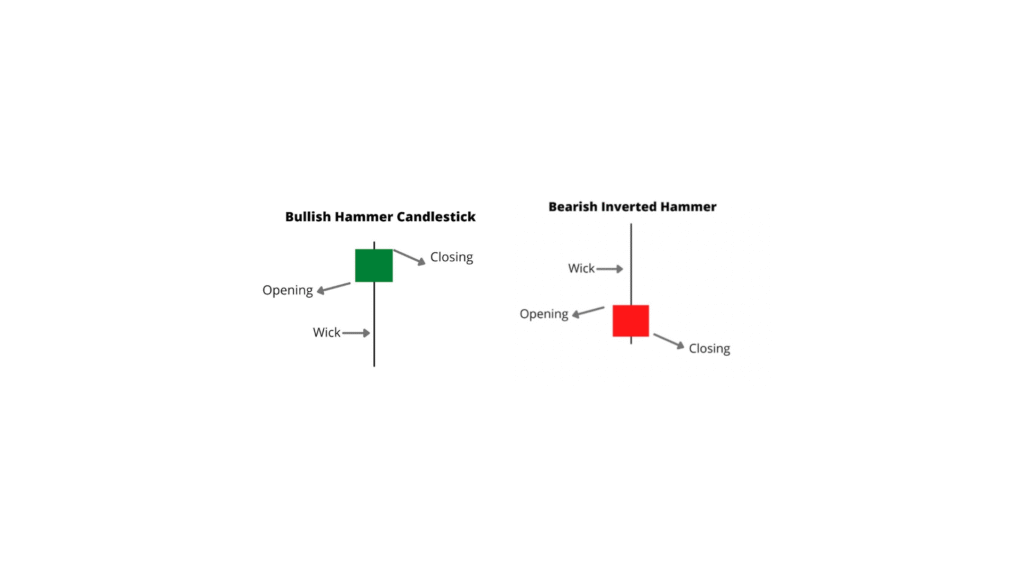
A small body near the top of the candle
A long lower wick (at least 2x the size of the body)
Little to no upper wick
It means sellers pushed the price way down, but buyers fought back hard, closing near the open — a sign of potential reversal.
What It Tells You:
“Buyers are stepping in after a strong sell-off. A reversal might be on the way.”
But remember: don’t jump in too fast. Wait for confirmation (like the next candle going up) before making a trade.
A hammer pattern shows up when the market starts off weak — prices drop after the open — but then, something interesting happens: buyers jump in and push the price right back up.
By the time the trading session ends, the price closes near the top, leaving a long lower wick behind. That wick? It’s like a shadow of what almost happened — sellers tried to take control but failed.
So what’s the takeaway?
👉 It tells us the bulls are fighting back.
And when this pattern forms at the bottom of a downtrend, it could mean the tide is turning — the market might be getting ready to move up.
📊 Does it Actually Work?
Yep — it’s not just a theory.
According to a study by Brett N. Steenbarger in the Journal of Futures Markets, the hammer pattern has around a 62% success rate for predicting bullish reversals. That means it works more often than not, but like anything in trading, it’s smart to wait for confirmation.
1. What is a Hammer Candlestick Pattern?
A hammer is a single candlestick pattern that typically shows up at the bottom of a downtrend. It has a small real body near the top, a long lower shadow, and little to no upper shadow. It signals that buyers are gaining strength after sellers pushed the price down.
2. What does the Hammer Pattern indicate?
The hammer suggests a possible bullish reversal. It shows that even though the price fell during the session, buyers stepped in and pushed it back up, closing near the high. It’s often seen as a sign that the market might be ready to move upward.
3. What makes it different from other candlesticks?
It’s all about the shape:
Long lower wick (at least twice the size of the body)
Tiny upper wick or none
Appears after a downtrend
That long lower wick shows that sellers tried to push the price lower, but failed.
4. Is the Hammer always bullish?
It’s usually bullish, but you should wait for confirmation (like a green candle the next day or volume increase). Without confirmation, the signal could be weak or false.
5. Can the Hammer appear during an uptrend?
If a similar shape appears during an uptrend, it’s called an Inverted Hammer, and it has a different meaning — usually a potential reversal downward.
6. How reliable is the Hammer Pattern?
It’s not 100% reliable (no pattern is), but studies suggest the hammer has a success rate of around 62% in predicting upward movement, according to research published in the Journal of Futures Markets.
7. What timeframe works best for spotting Hammer patterns?
Hammers can appear on any timeframe (1-min, daily, weekly), but they’re more reliable on higher timeframes like daily or 4-hour charts.
8. How do I confirm a Hammer signal?
Look for:
A bullish candle after the hammer
Increased volume
Support level nearby
These help confirm the strength of the reversal.
9. Can I trade based on the Hammer alone?
It’s not recommended to rely on it by itself. Combine it with:
Support/resistance zones
Volume analysis
Other indicators (like RSI, MACD)
10. What’s the difference between a Hammer and a Hanging Man?
Both look similar — but context matters:
A Hammer comes after a downtrend (bullish sign)
A Hanging Man comes after an uptrend (bearish sign)

Leave a Reply