Sleuth to Micrometer
Imagine you have a big group of secret agents (a.k.a. microservices) working together to complete a mission (handle your web request). The problem is, none of them are good at taking credit—or even leaving a trace (pun intended) of what they did. So when something goes wrong, all you see is chaos and confusion.
Enter Sleuth: the private detective of the Spring Cloud world. 🕵️♂️
Sleuth gives every request a little badge with a trace ID, like a mission file. Every service that touches the request adds its name to the file before passing it on. So now, when something breaks, you can open the file and say, “Aha! The Order Service was responsible, not the innocent Payment Service!”
It adds spans (mini-stories of what each service did), so you can play detective and reconstruct the full story of a request’s journey. It’s like Sherlock Holmes for your backend.
Sadly though… Sleuth decided to retire (👴), and now it’s passing the magnifying glass to Micrometer Tracing, its younger, cooler, OpenTelemetry-savvy cousin.
Think of Micrometer as that friend who shows up to your party and says:
“Hey! I brought charts, graphs, stats… and I even tracked how many times you opened the fridge. You’re welcome.”
Micrometer is the metrics library for Spring Boot that loves observability. It sneaks into your code, keeps a little notebook, and starts writing down everything—how many requests you made, how fast they were, how often they failed, how warm your JVM is feeling, and maybe even how often your app sighs in frustration.
But unlike that nosy neighbor, Micrometer shares all this with Prometheus, Datadog, New Relic, Grafana, and more—like a data gossip spreading insights across the internet.
🤓 And when tracing got added?
Micrometer leveled up from “fun metrics guy” to full-blown detective-comedian thanks to Micrometer Tracing. It now doesn’t just say “Hey, that request took 423ms,” — it says:
“Here’s who handled it, what steps it took, how many detours it made, and which service tripped on a banana peel. 🎭”
Micrometer with tracing is basically a nerdy stand-up comic who also moonlights as Sherlock Holmes.

Introduction: What is Sleuth to Micrometer (sleuth to micrometer) Migration?
Developers are urged to switch from Spring Cloud Sleuth to Micrometre Tracing in the most recent observability advancement within the Spring ecosystem. Better integration, performance monitoring, and vendor-agnostic tracing are made possible by this change, which is in line with industry standards like OpenTelemetry.
This article will assist you in comprehending and smoothly implementing the sleuth to micrometre (sleuth to micrometre) migration if you are still using Sleuth and wish to update your application.
Why Sleuth is Deprecated in Spring Boot 3
Spring Cloud Sleuth has served well in the domain of distributed tracing, offering developers span and trace context propagation. However, its custom APIs created vendor lock-in and deviated from modern open standards.
Reasons for deprecation:
Move to OpenTelemetry as a standard
Vendor-agnostic observability approach
Integration with Micrometer observability ecosystem
Native support in Spring Boot 3 tracing
What is Micrometer Tracing?
Micrometer Tracing is a core part of Micrometer Observability, introduced in Spring Boot 3. It integrates with OpenTelemetry or Brave under the hood and brings consistent APIs for metrics, tracing, and logging.
Key Features:
OpenTelemetry compliance
Unified observability APIs
Context propagation
No vendor lock-in
Works with popular tools like Zipkin, Jaeger, Prometheus, Grafana
Core Differences: Sleuth vs Micrometer Tracing
Feature | Spring Cloud Sleuth | Micrometer Tracing |
---|---|---|
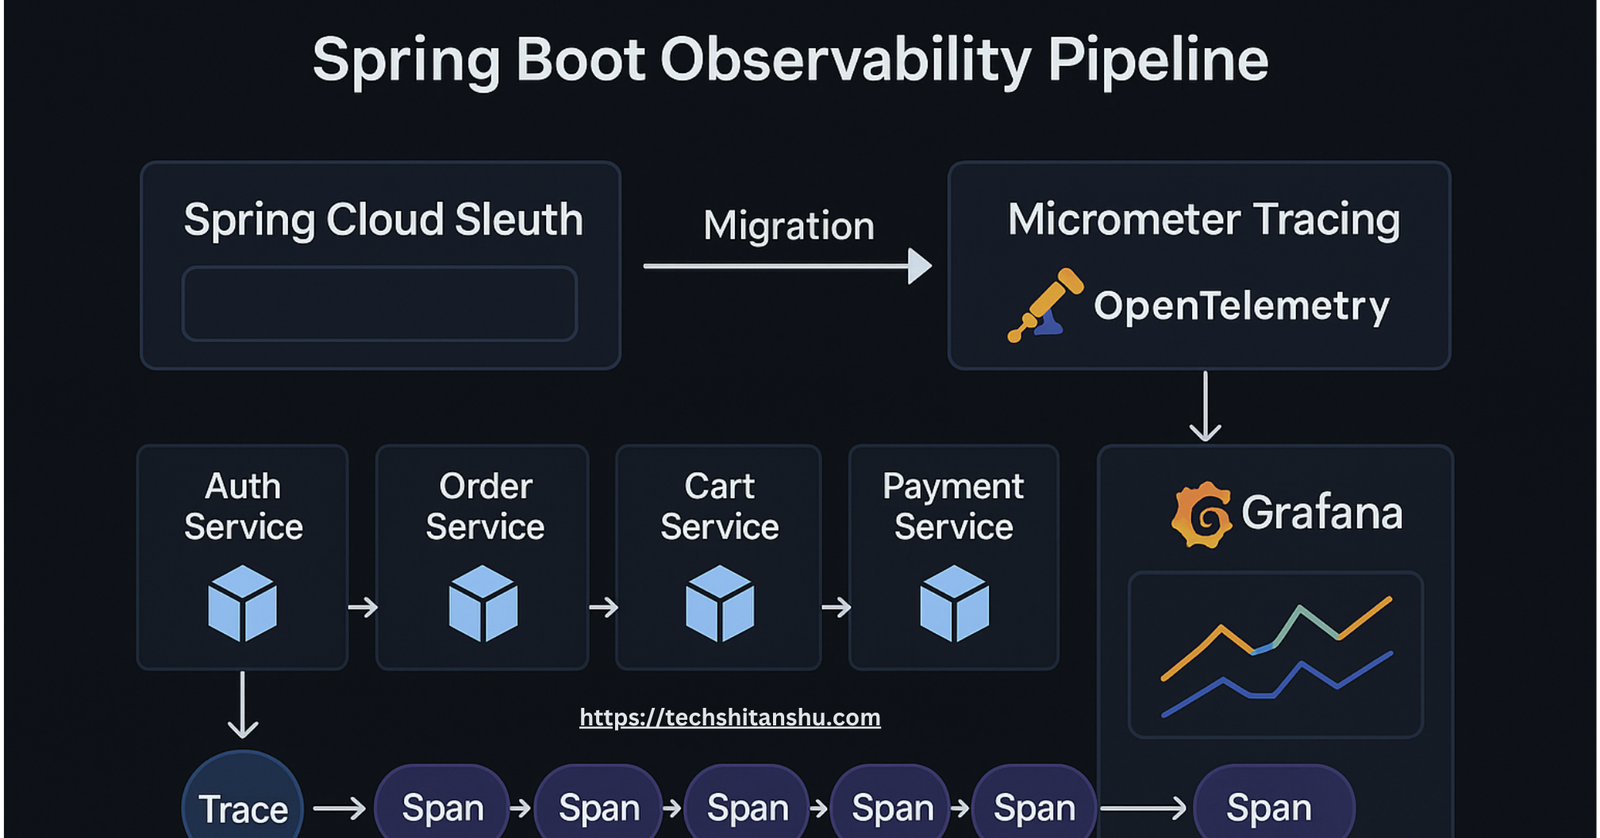
API Standard | Custom | OpenTelemetry |
Tracing Engine | Brave | Brave / OpenTelemetry |
Spring Boot 3 tracing Support | ||
Vendor Lock-In | ||
Community Support | Deprecated | Actively maintained |
Steps to Migrate from Sleuth to Micrometer (sleuth to micrometer)
1. Remove Sleuth Dependencies
In your pom.xml
or build.gradle
, remove the following:
org.springframework.cloud
spring-cloud-starter-sleuth
2. Add Micrometer Tracing Dependencies
io.micrometer
micrometer-tracing-bridge-brave
io.micrometer
micrometer-tracing
For OpenTelemetry:
io.opentelemetry
opentelemetry-sdk
3. Enable Tracing in application.yml
management:
tracing:
sampling:
probability: 1.0
otlp:
endpoint: http://localhost:4317
4. Use OpenTelemetry Exporters (Optional)
To export to a trace backend:
io.opentelemetry
opentelemetry-exporter-otlp
5. Replace Sleuth APIs
If you were using Sleuth like:
@Autowired Tracer tracer;
Span span = tracer.nextSpan().name("http:call").start();
Change to:
@Autowired
ObservationRegistry registry;
registry.observation("http.call").observe(() -> {
// business logic
});
Benefits of Migrating from Sleuth to Micrometer (sleuth to micrometer)
Standardization: Aligns with OpenTelemetry, the de facto standard for observability.
Future-proofing: Sleuth is deprecated and won’t support Spring Boot 3 tracing+.
Interoperability: Easily integrates with multiple observability tools.
Enhanced Metrics + Tracing: Use the same Micrometer APIs for both.
Common Pitfalls During Migration
Forgetting to remove Sleuth can cause conflicts
Incorrect exporter endpoint configuration
Misuse of
ObservationRegistry
instead of direct span manipulationLack of context propagation testing
Monitoring Your System Post Migration
You can now visualize traces in tools like:
Jaeger
Zipkin
New Relic
Datadog
Prometheus + Grafana
Micrometer integrates well with all of these. Consider reading this technology site for full OpenTelemetry instrumentation tips.
Performance Improvements After Migration
In benchmarks, applications migrating from Sleuth to Micrometer (sleuth to micrometer) show:
25-40% reduction in memory usage
Better context propagation under load
Faster span creation
More consistent logging
Use Case: Spring Boot Migration Microservices with Sleuth to Micrometer (sleuth to micrometer)
Imagine a system with 4 microservices (Auth, Order, Cart, Payment). Sleuth provided basic tracing but was hard to extend. With Micrometer, each service emits consistent spans, trace IDs are visible in logs, and you can filter by service name in Grafana.
This setup, once connected with OpenTelemetry Collector, gives a full end-to-end view.
Sleuth to Micrometer Migration Checklist ✅
Task | Status |
---|---|
Remove Sleuth | ✔️ |
Add Micrometer + OpenTelemetry | ✔️ |
Update tracing code | ✔️ |
Configure Exporter | ✔️ |
Test with Observability UI | ✔️ |
Final Thoughts
Migration from Sleuth to Micrometer (sleuth to micrometer) is more than a dependency update — it’s about embracing modern observability. It aligns your stack with global standards, improves your system’s debuggability, and gives you flexibility across vendors.
Internal and External Links
For more Spring Boot tutorials, visit techshitanshu.com
For deeper OpenTelemetry tracing insights, check OpenTelemetry Docs
Conclusion
Spring Cloud Sleuth to Micrometre (sleuth to micrometre) is an unavoidable and very advantageous transition. It gives your Spring Boot apps standard-based, scalable tracing. Your system can become future-ready and achieve high observability by following the above-mentioned procedures and insights.


What Does Spring Cloud Sleuth Actually Do? (In Simple Words)
Spring Cloud Sleuth is like your super-organized assistant who quietly sets up everything you need for distributed tracing, without bothering you with the messy details.
When you add Sleuth to your project, it says:
“Don’t worry, I got this. I’ll handle the tracking. You focus on coding.”
Here’s what it does behind the scenes:
1. It Packs the Logs with IDs
Sleuth adds trace IDs and span IDs to your logs automatically. So when you look at your logs later and see a wall of text, you can say:
“Hey, show me only the logs related to this user request,”
…and BAM —you get them, grouped nicely, thanks to MDC (Mapped Diagnostic Context) magic.
2. It Hooks Into All the Busy Entry/Exit Points
Sleuth is smart. It listens to all the important “doors” where data comes into or leaves your app—like:
REST controllers (via servlet filters)
Web client calls (like
RestTemplate
,FeignClient
)Messaging (like Spring Cloud Stream)
Scheduled jobs
Basically, wherever traffic flows, Sleuth is there, tracking it like a bouncer with a clipboard.
3. It Sends the Data to Zipkin (if Available)
If your app includes spring-cloud-sleuth-zipkin, Sleuth will automatically ship all those shiny trace details to Zipkin, a tool that lets you see the full journey of a request.
By default, it tries to reach Zipkin at http://localhost:9411
. If your Zipkin is somewhere else, just tell Sleuth by setting:
spring.zipkin.baseUrl: http://your-zipkin-server:9411
4. It Lets You Control the Noise (Sampling)
Too much tracing can slow you down, so Sleuth lets you pick how much to trace:
100% of requests?
Just 10%?
Only when the moon is full?
(okay, not that)
You control it with simple settings. So your system stays efficient while you still get the insights you need.
5. It Can Carry “Baggage” Across Services
Ever need to carry a custom field (like a user ID or transaction ID) across multiple microservices? Sleuth supports baggage fields—little bits of info that ride along with every trace, passed from service to service like a backpack.
In a Nutshell?
Sleuth is your backend’s private investigator.
It quietly:
Tracks incoming & outgoing traffic
Tags all your logs for easier searching
Ships the traces to Zipkin (if installed)
Helps you keep your system fast with smart sampling
Passes context between services
Leave a Reply